
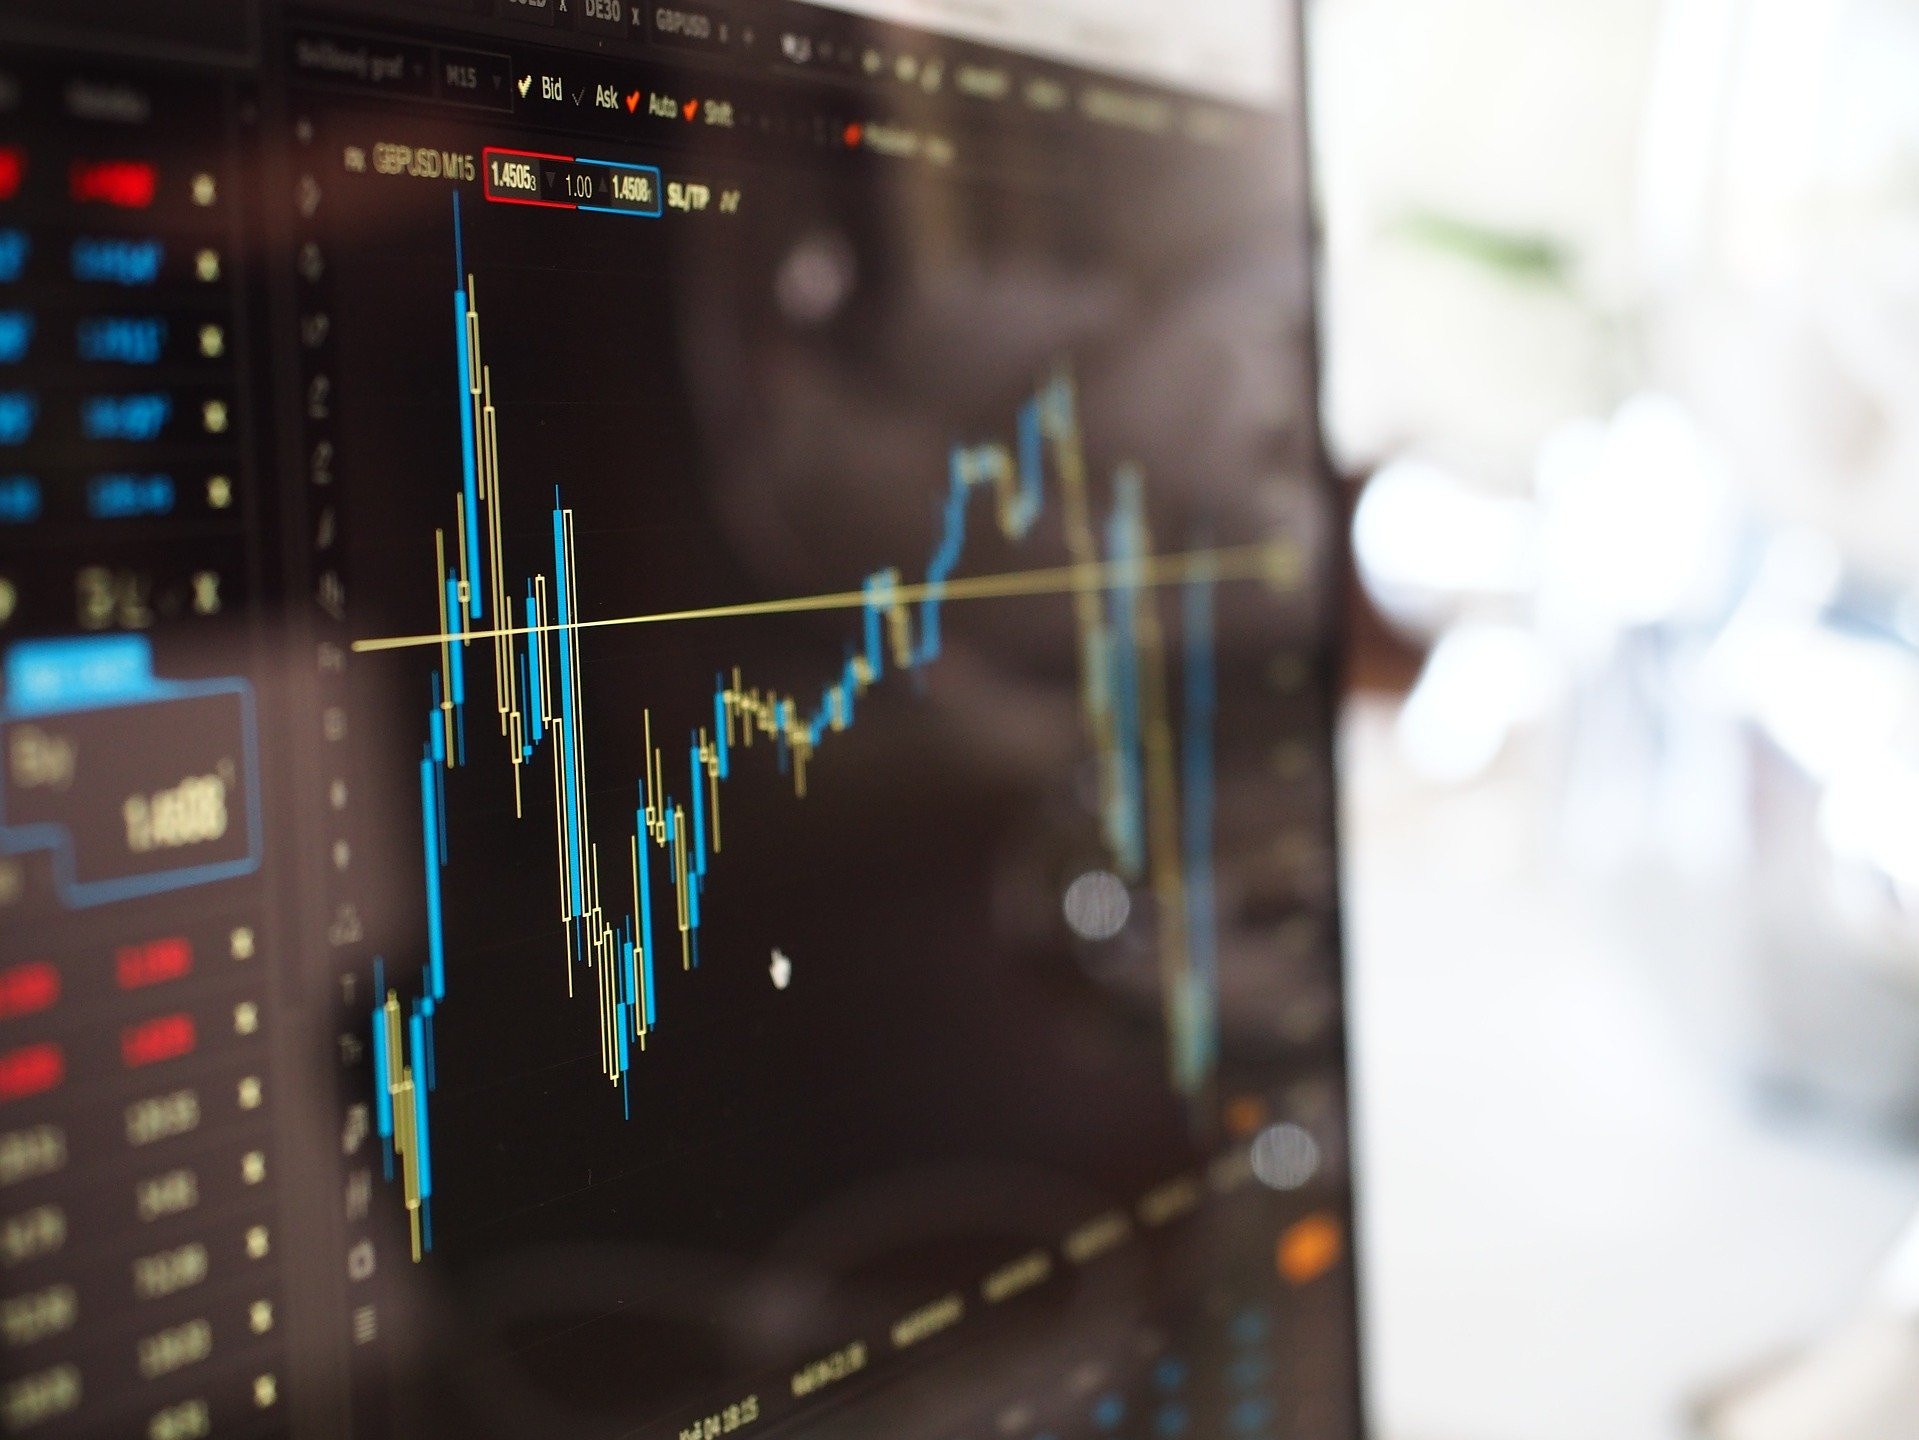
The technical analysis evaluates investment and trading decisions by observing market data, such as past prices and volume.
It seeks to identify price patterns and market trends in financial markets and exploit those patterns.
Many technical indicators range from simple moving averages (used to gauge trend strength) to more complex tools like Bollinger Bands (used to measure volatility).
They also include patterns like head-and-shoulders or double tops/bottoms, indicating reversal points.
Here’s our list of the top 9 most popular ones:
Fibonacci ratios
They identify support and resistance levels. It’s a method of technical analysis that uses the numbers 0, 1, 1, 2, 3, 5, 8, 13 and 21 (and sometimes the reverse), known as “Fibonacci numbers”, to represent critical levels in financial markets.
They are derived from three consecutive numbers. For example, 8-13-21.
Moving averages
They find support/resistance points because they show the average price over a given period, making it easier for investors to identify trends.
Traders will often use moving averages as a simple way to gauge whether a stock is bullish or bearish.
For instance, it’s bullish if a stock is trading above its 200-day moving average. If it is trading below its 200-day moving average, it’s bearish.
Fibonacci retracement
They find potential support and resistance points. It draws trend lines based on the key Fibonacci ratios of 23.6%, 38.2%, 50% and 61.8%.
These are useful for spotting reversal levels, especially after sharp declines or strong rallies.
For example, if the price falls sharply but finds support at the 0.618 fib level, there is potential for a rebound rally, whereas if the price bounces off the 0.382 or 0.236 levels, there may be further downside in store.
Bollinger bands
They are used to measure the relative volatility and price movements. It uses standard deviation (differences from the mean average) as an indicator to determine overbought or oversold conditions in the market.
They also show a trend reversal at hand because they expand and contract with price action.
When the bands are close together, prices are low, which means that volatility is low too. It implies high-volatility conditions when they’re far apart, which often leads to sharp reversals that “break out” of this pattern.
Relative strength index (RSI)
They are used to identify if securities are overbought or oversold. RSI measures speed and change in price movements by comparing the average gain or loss of a security during a specific period to the highs and lows of that same throughout a trading time frame.
RSI is used chiefly over 50 periods, but some use shorter and longer timeframes.
A buy signal is given when it falls below 30 and rises back up above 30. Sell signals are triggered when it goes 70 or above.
On-balance volume (OBV)
They determine if there’s enough power behind price movements in either direction. It adds volume when prices move lower for an uptrend and subtracts volume when prices move higher for a downtrend.
When the indicator starts moving lower from peak buying activity, this often presents an excellent opportunity to go short because that means that momentum is comparing the average gain or loss of a security during a specific period to the highs and lows of that same throughout a trading time frame.
RSI is used chiefly over 50 periods, but some use shorter and longer timeframes. A buy signal is given when it falls below 30 and rises back up above 30. Sell signals are triggered when it goes 70 or above.
Relative volatility (RVI)
RVI is used to evaluate how expensive or cheap a stock is relative to its history.
RVI compares the magnitude of swings in up and down trends over various periods and then projects forward ten periods to identify potential future resistance and support levels, as well as high-risk reversal points.
Relative Vigor Index
Similar to RSI, except it compares weekly closes rather than daily closes; therefore, it has less noise or whipsaw effect.
It buys signals when it falls below 40 and sells signals when it rises above 60.
Link to Saxo capital markets for more information


More Stories
Negotiating Technology Contracts
Civilian Applications of GPS Technology
Technology and the Age of Exploration